Analyze Trail with Amazon OpenSearch Service
Collect, index, and visualize audit logs for analysis and investigation.
Amazon OpenSearch Service
- Create OpenSearch Domain
-
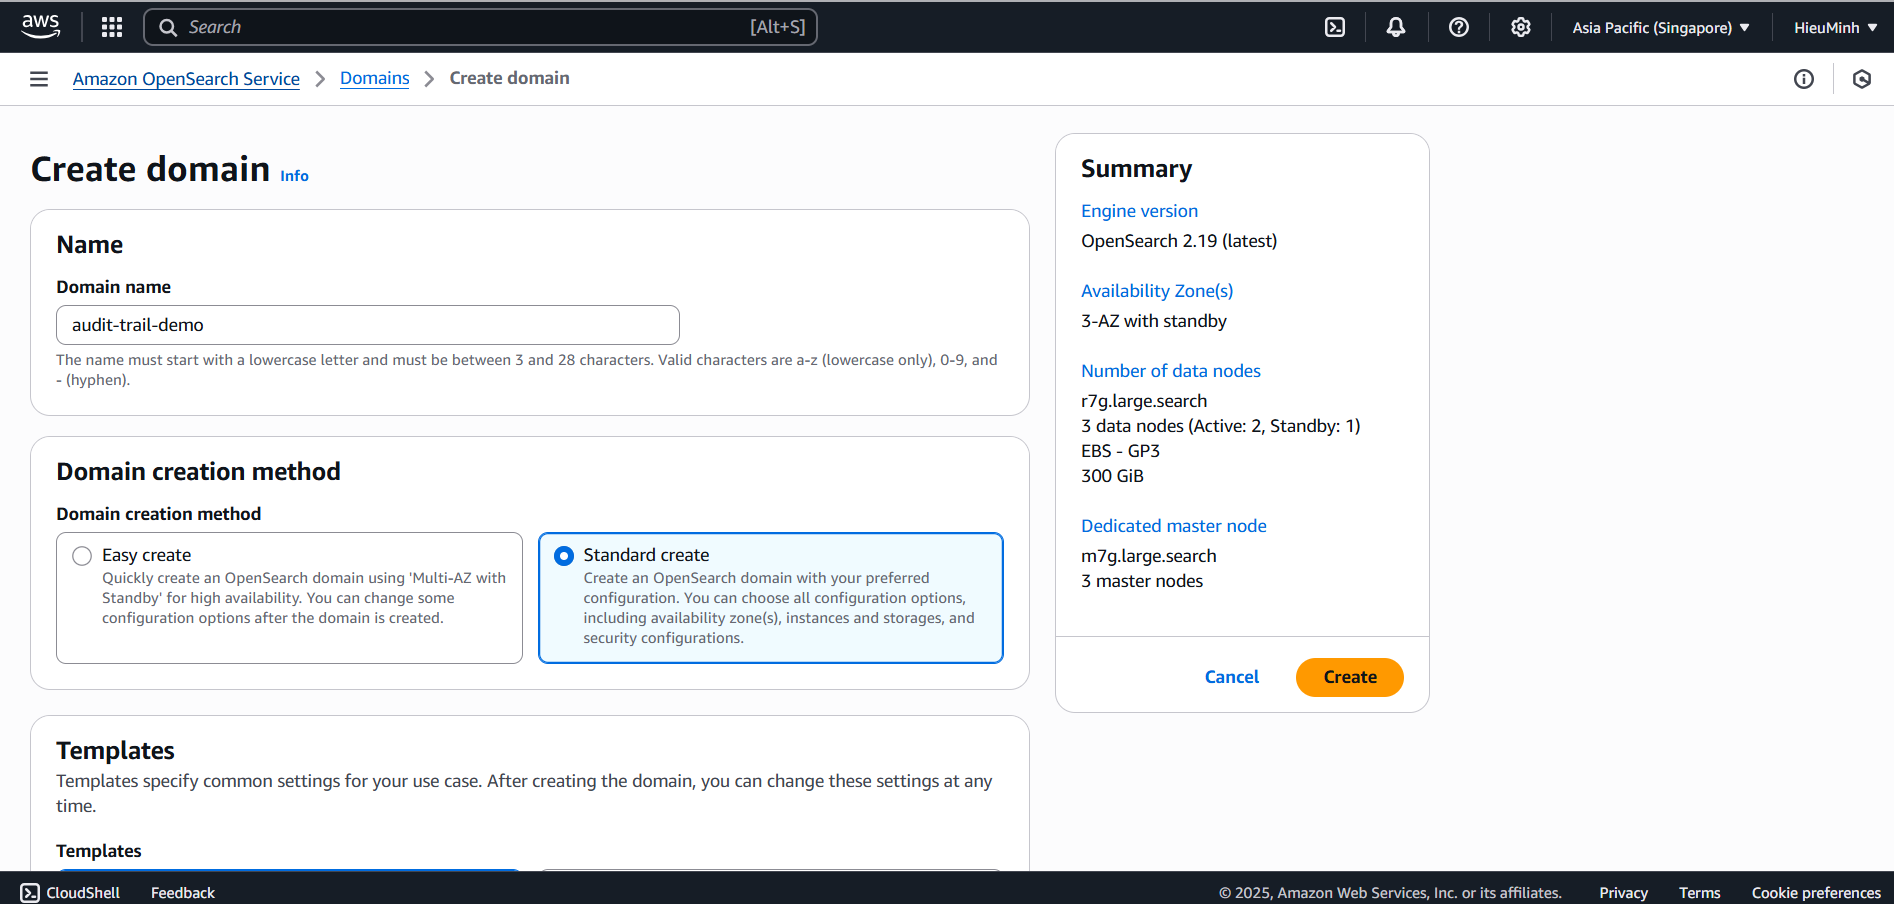
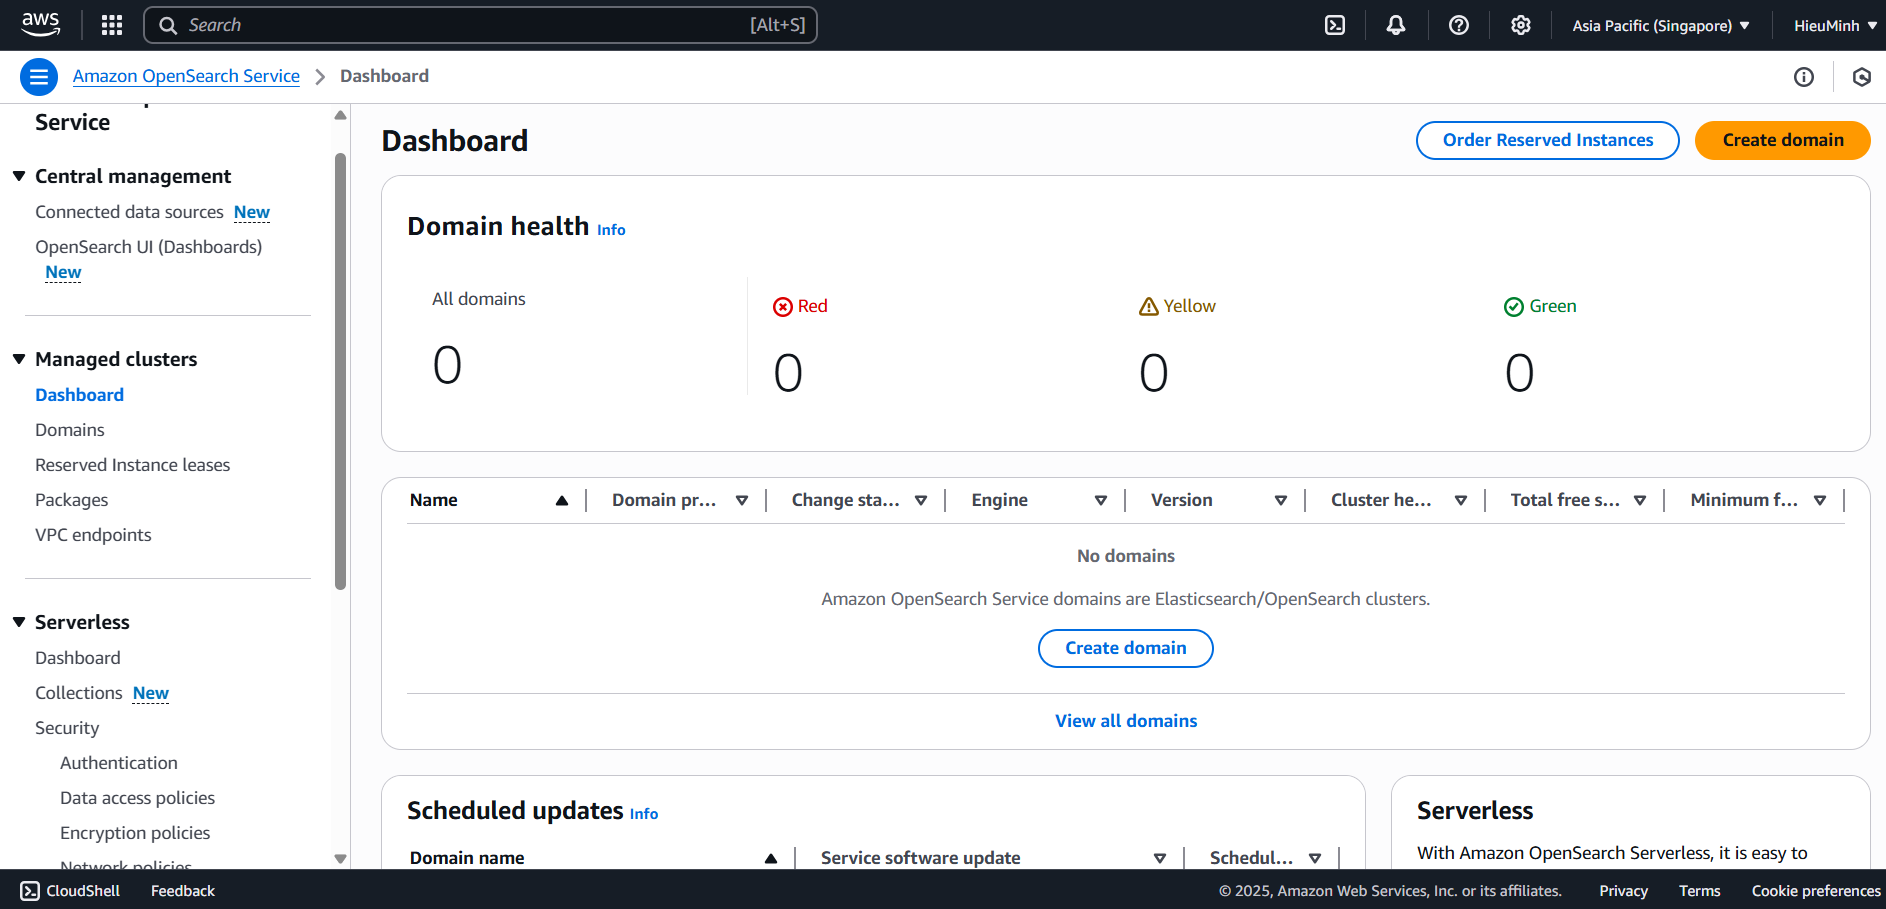
AWS Console → OpenSearch Service → Create domain.
-
Select Deployment type: Development and testing.
-
Set Domain name:
audit-trail-demo. -
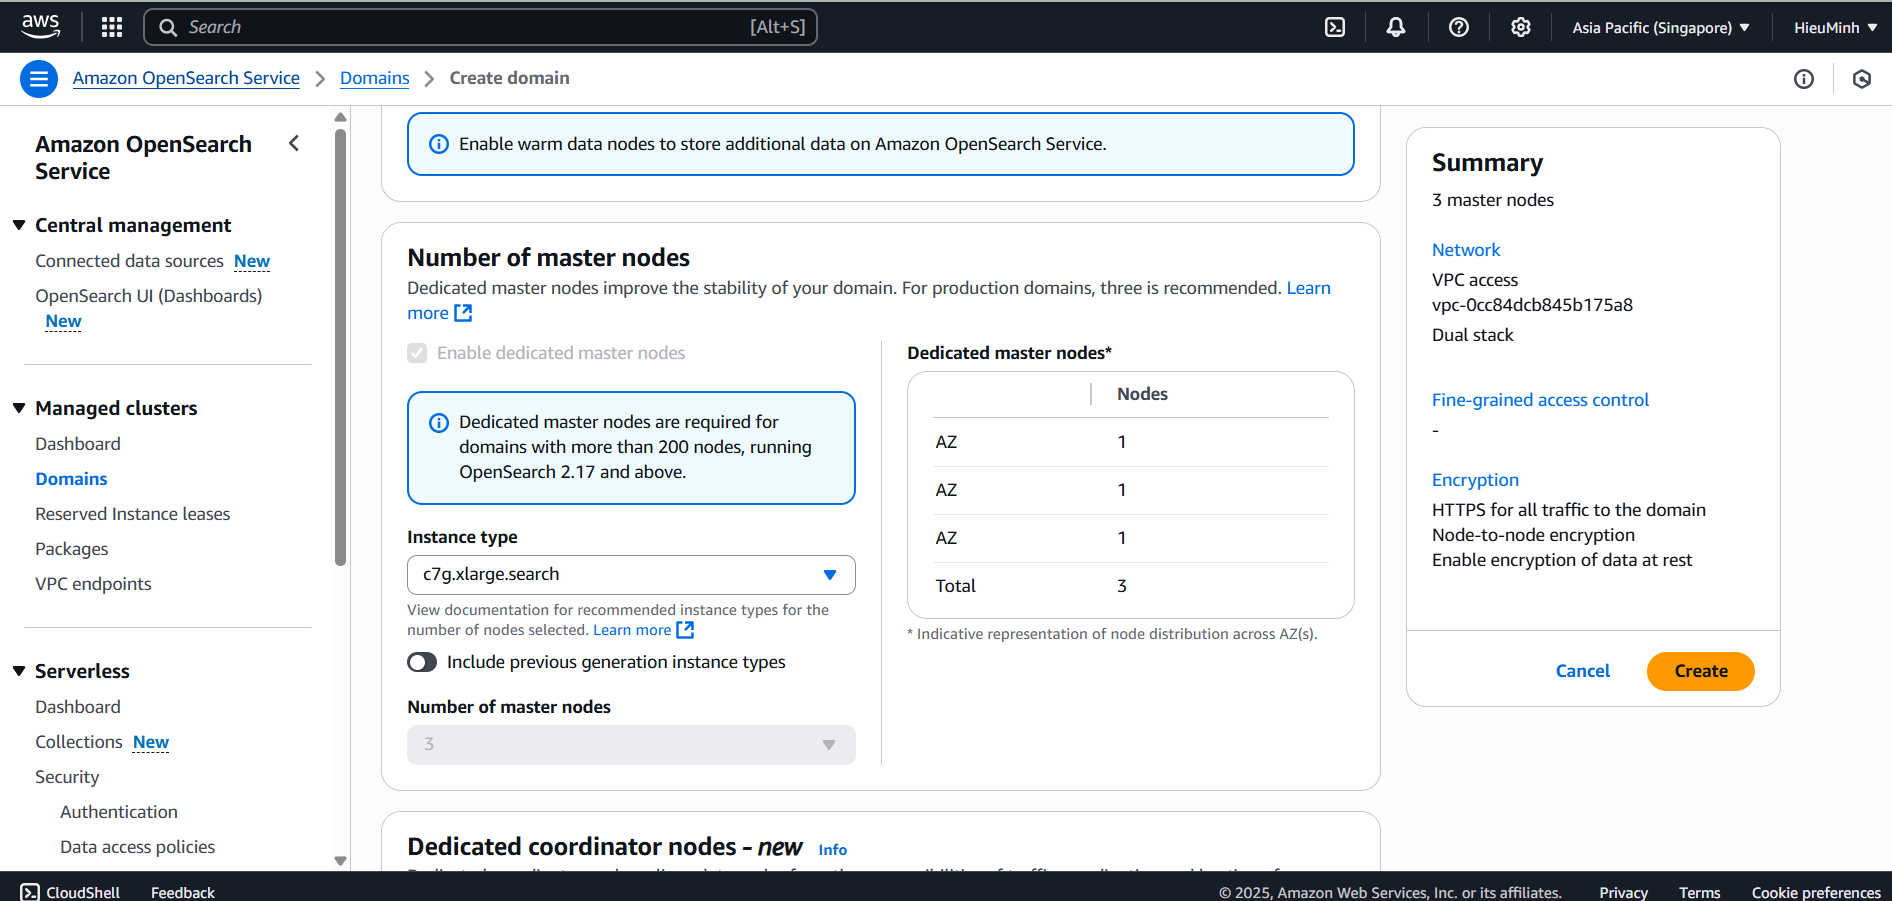
Set capacity: 1 instance, type
c7g.xlarge.search. -
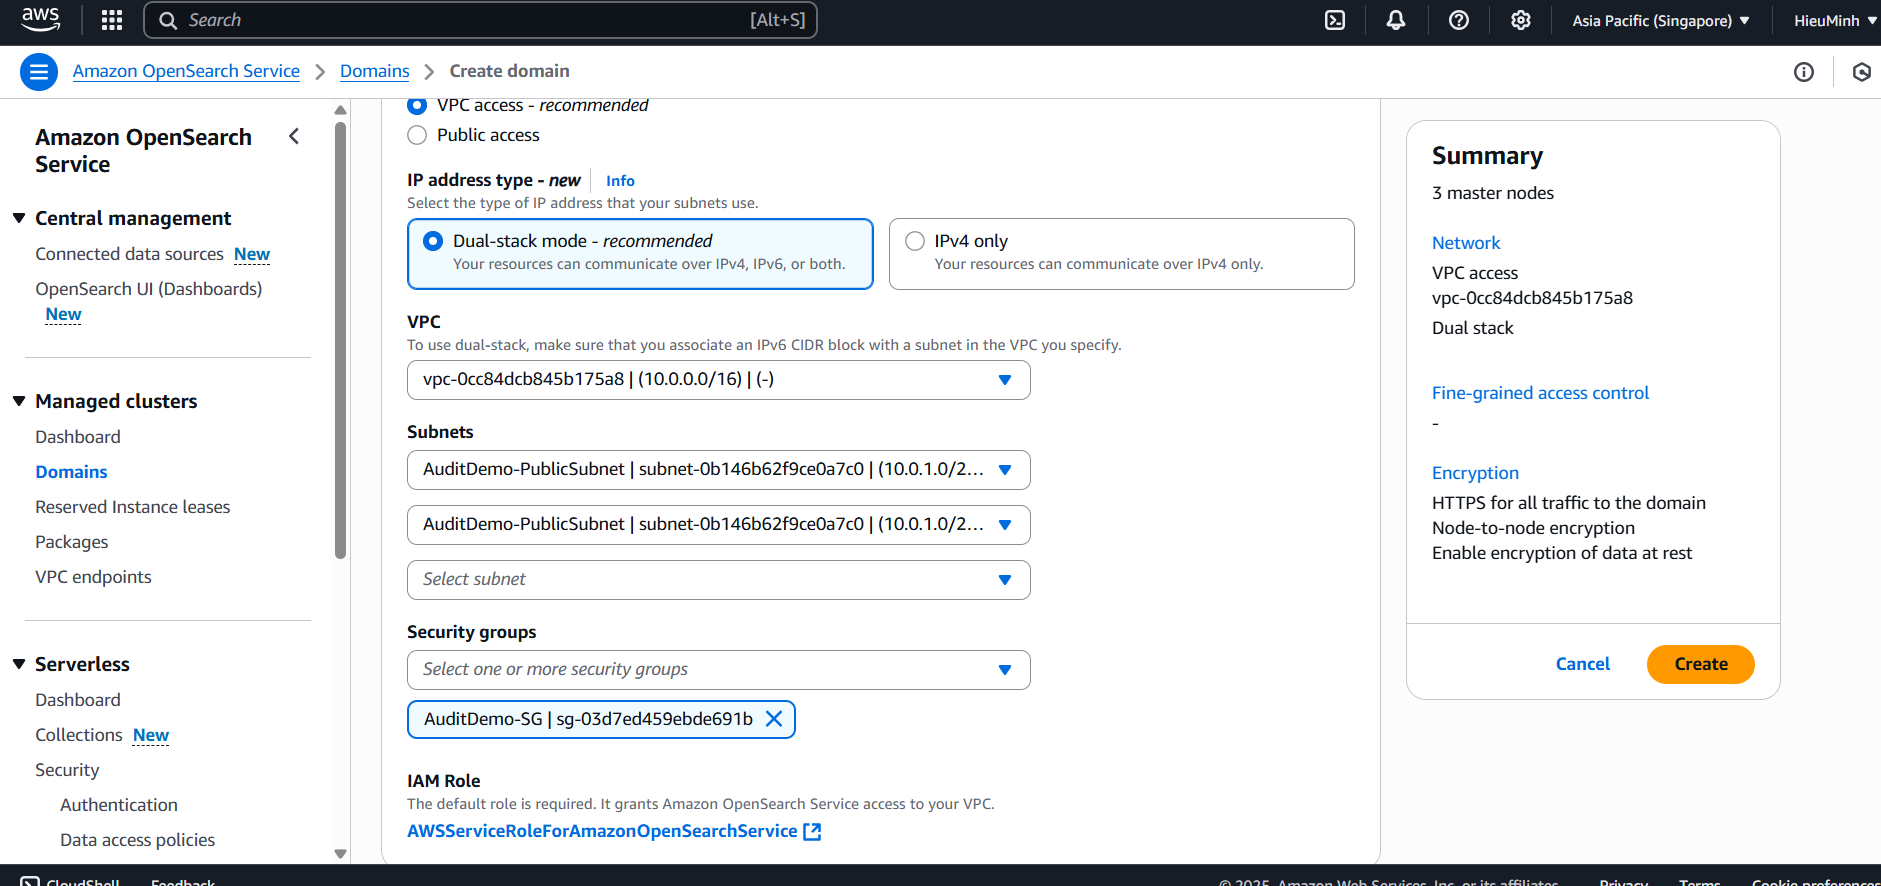
Network configuration:
- VPC:
AuditDemo-VPC - Subnet:
AuditDemo-PublicSubnet(Go to Route tables -> Edit subnet associations -> select both Subnets -> click Save) - Security Group:
AuditDemo-SG - Fine-grained access control: Create master user (Create your own username and password)
- VPC:
-
Access policy (allow Lambda and you to access):
{ “Version”: “2012-10-17”, “Statement”: [ { “Effect”: “Allow”, “Principal”: { “AWS”: [ “arn:aws:iam::<ACCOUNT_ID>:role/AuditLoggerLambdaRole”, “arn:aws:iam::<ACCOUNT_ID>:user/” ] }, “Action”: “es:”, “Resource”: “arn:aws:es::<ACCOUNT_ID>:domain/audit-trail-demo/” } ] }
-
Click Create domain and wait for the status to become Active.
I tried but still don’t know how to create the domain correctly.
- On the Kinesis page, select Create data stream
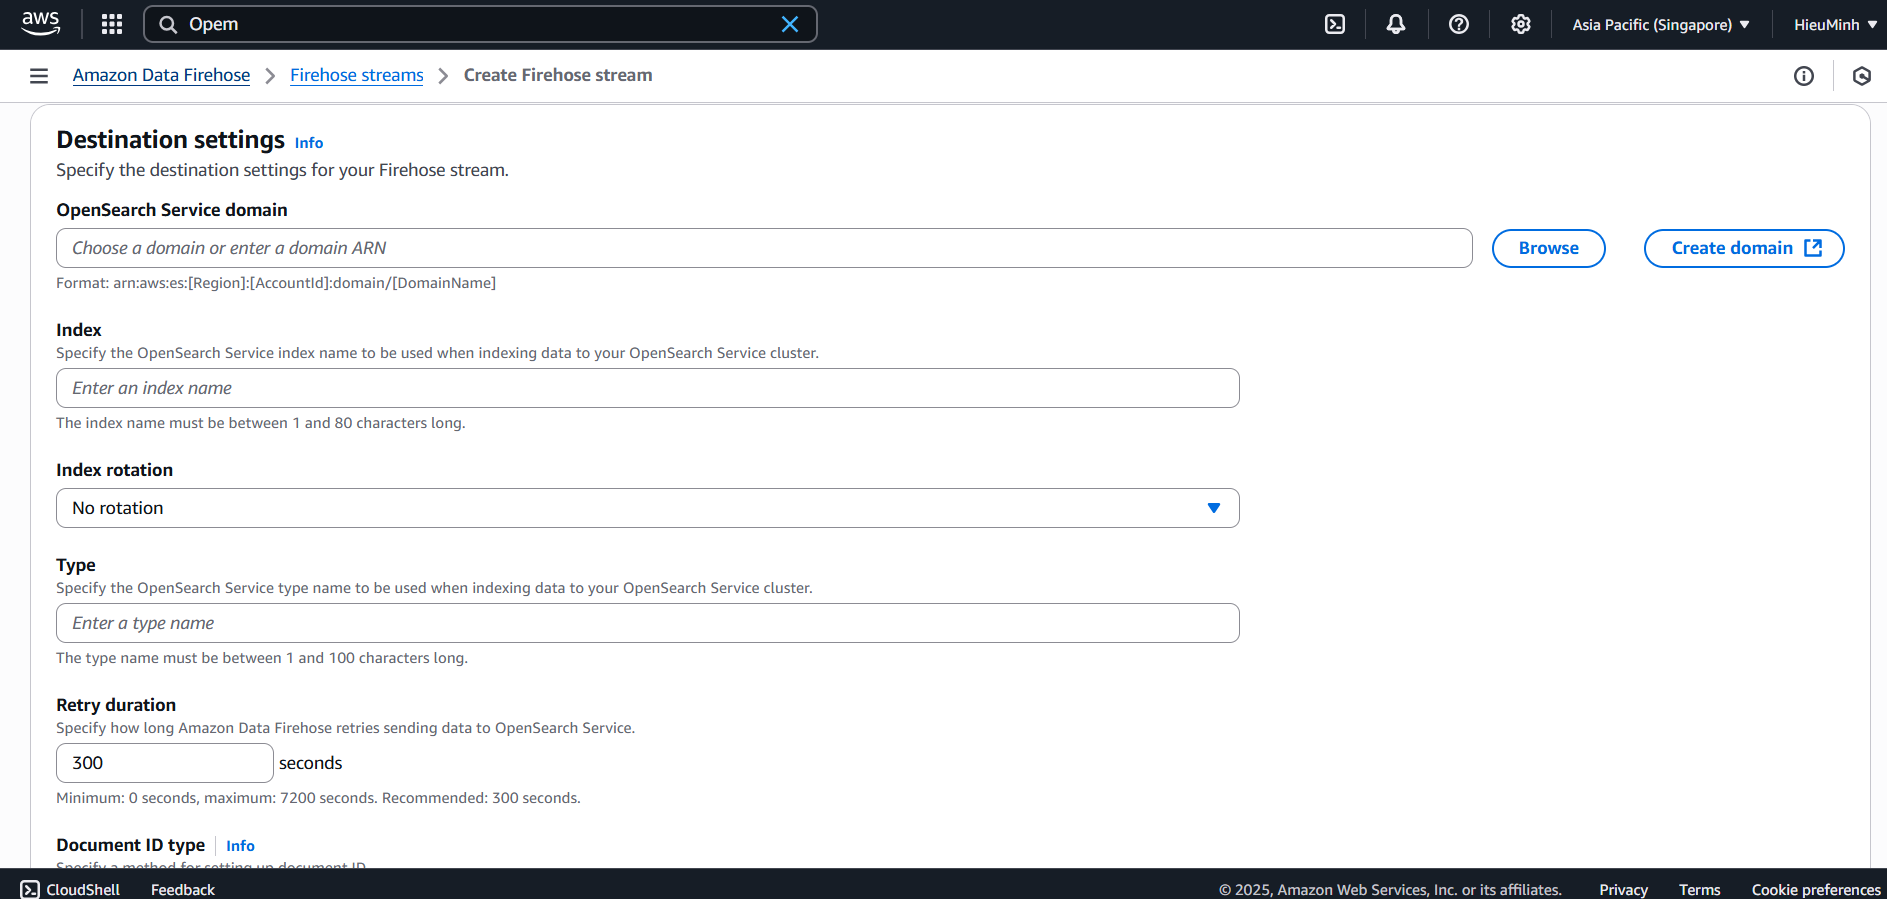
- Console → Kinesis Data Firehose → Create Firehose stream.
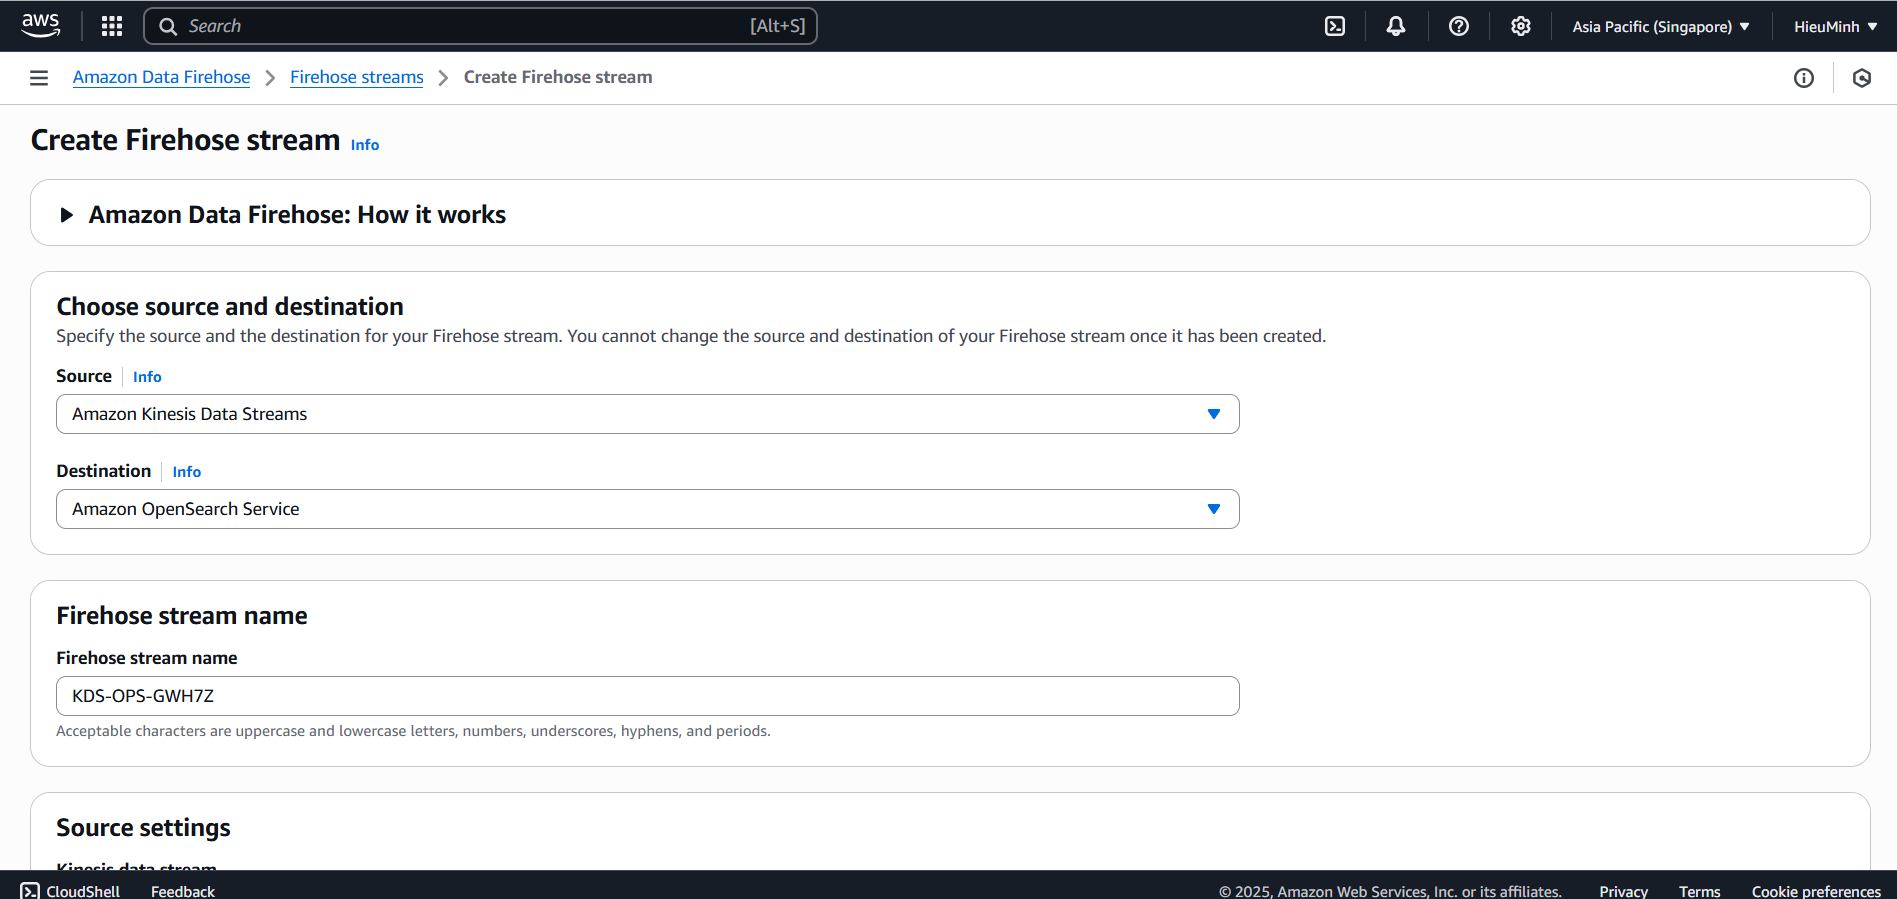
- Source: select Amazon Kinesis Data Stream
AuditStream(or Direct PUT if not using buffer). - Destination: Amazon OpenSearch Service → Domain
audit-trail-demo→ enter Index nameaudit-logs.
Step 1 must be completed.
- Role: select (or create) IAM Role
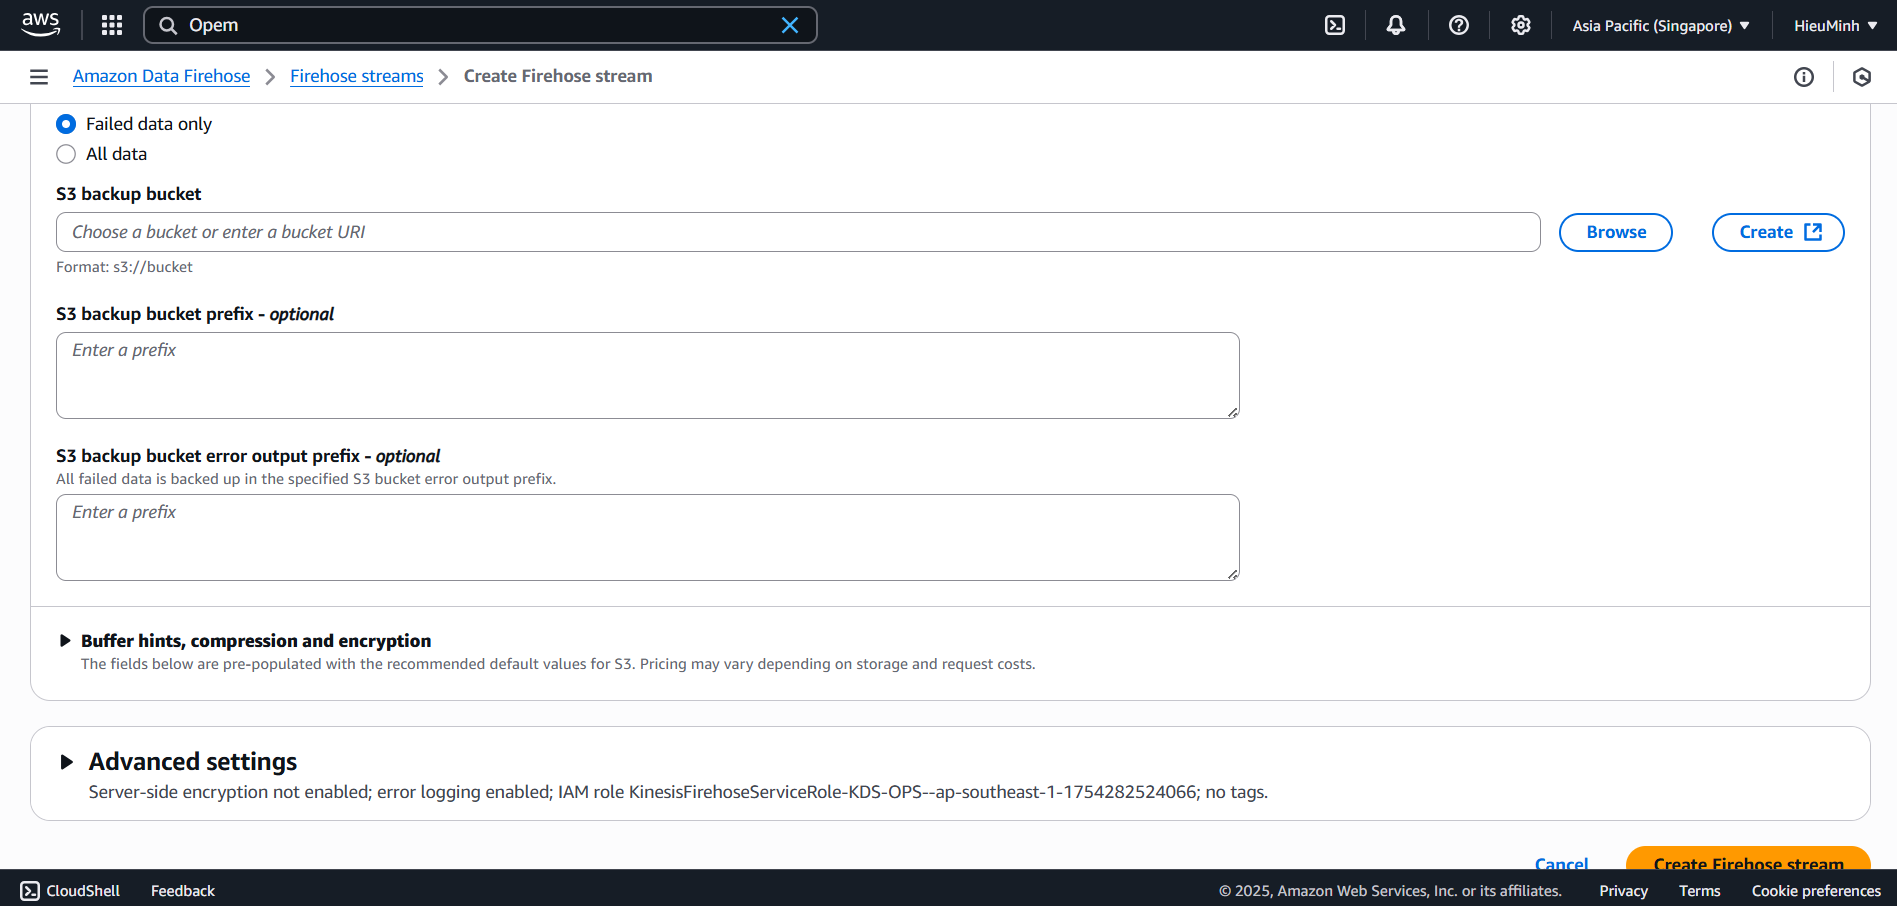
FirehoseDeliveryRolewithes:ESHttpPostands3:PutObjectpermissions (if backup is enabled). - (Optional) enable S3 backup to save a copy of logs to a bucket like
audit-demo-backup. - Click Create delivery stream.
- Connect CloudWatch Logs to Firehose:
- Console → CloudWatch → Log groups → select /aws/lambda/AuditLoggerDemo → Actions → Stream to AWS service.
- Select Kinesis Firehose → select stream AuditStream → Save.
- Create Index Pattern & Visualizations on OpenSearch Dashboards
-
Open OpenSearch Dashboards from the link in the OpenSearch Console.
-
Go to Stack Management → Index Patterns → Create index pattern:
- Index pattern:
audit-logs* - Select the timestamp field (
timestampor@timestamp) to filter by time.
- Index pattern:
-
Visualize Library → Create visualization:
- Bar chart: count of documents by action field.
- Date histogram: timeline of events by time frame.
- Data table: top 10 users with the most events (group by user).
-
Dashboard → Create dashboard
Audit Trail Dashboard→ Add the visualizations you just created.
- Test & Verify
-
Send some test events via Lambda (step 2) to generate logs.
-
Wait a few minutes, Firehose will push data to OpenSearch.
-
Discover: on Dashboards, go to the Discover tab to view raw logs.
-
Dashboard: open
Audit Trail Dashboard, check:- Bar chart displays the correct number of events by
action. - Timeline displays continuously by timestamp.
- Data table correctly lists the top users.
- Bar chart displays the correct number of events by
Completing all steps will display the results.