Investigation Tools with Amazon QuickSight
Amazon QuickSight
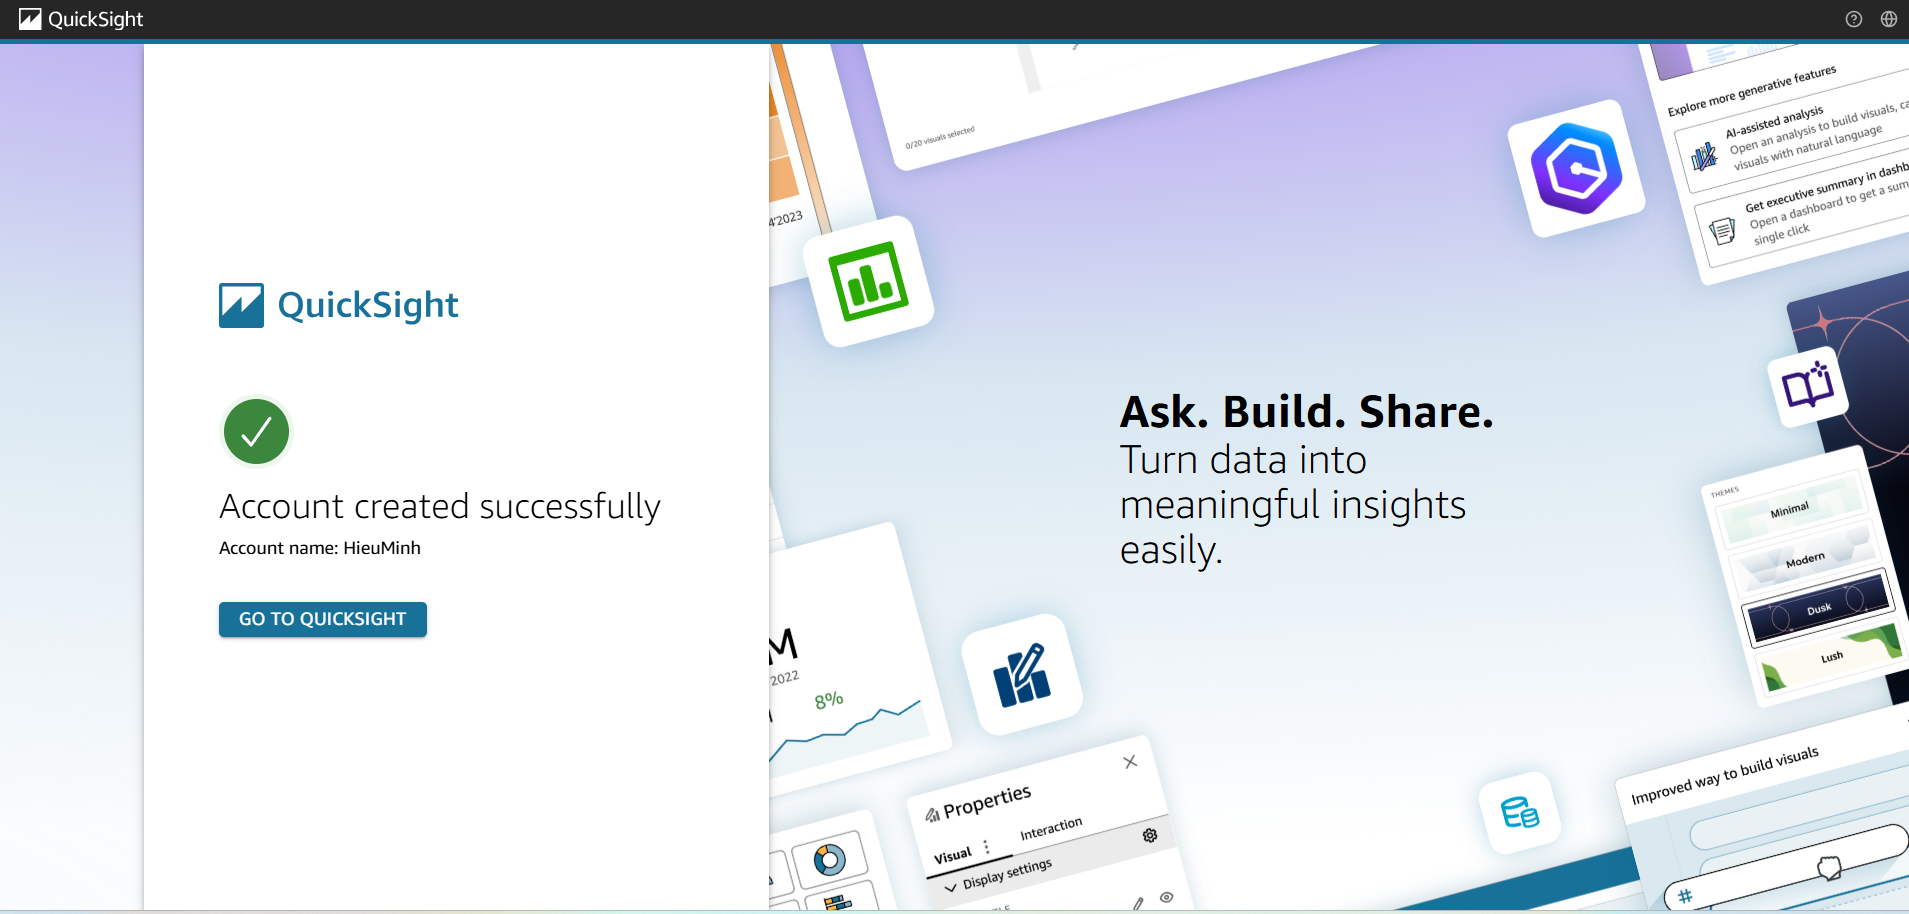
You need to create a QuickSight account to try this demo.
- Grant QuickSight access to data
- In QuickSight Home, click Manage QuickSight → Security & permissions.
- In the QuickSight access to AWS services section → click Manage → check Athena → Save.
- In the QuickSight access to AWS services section → click Select S3 buckets → select
audit-demo-logs-> and enable “Write permission for Athena Workgroup”. -> Save.
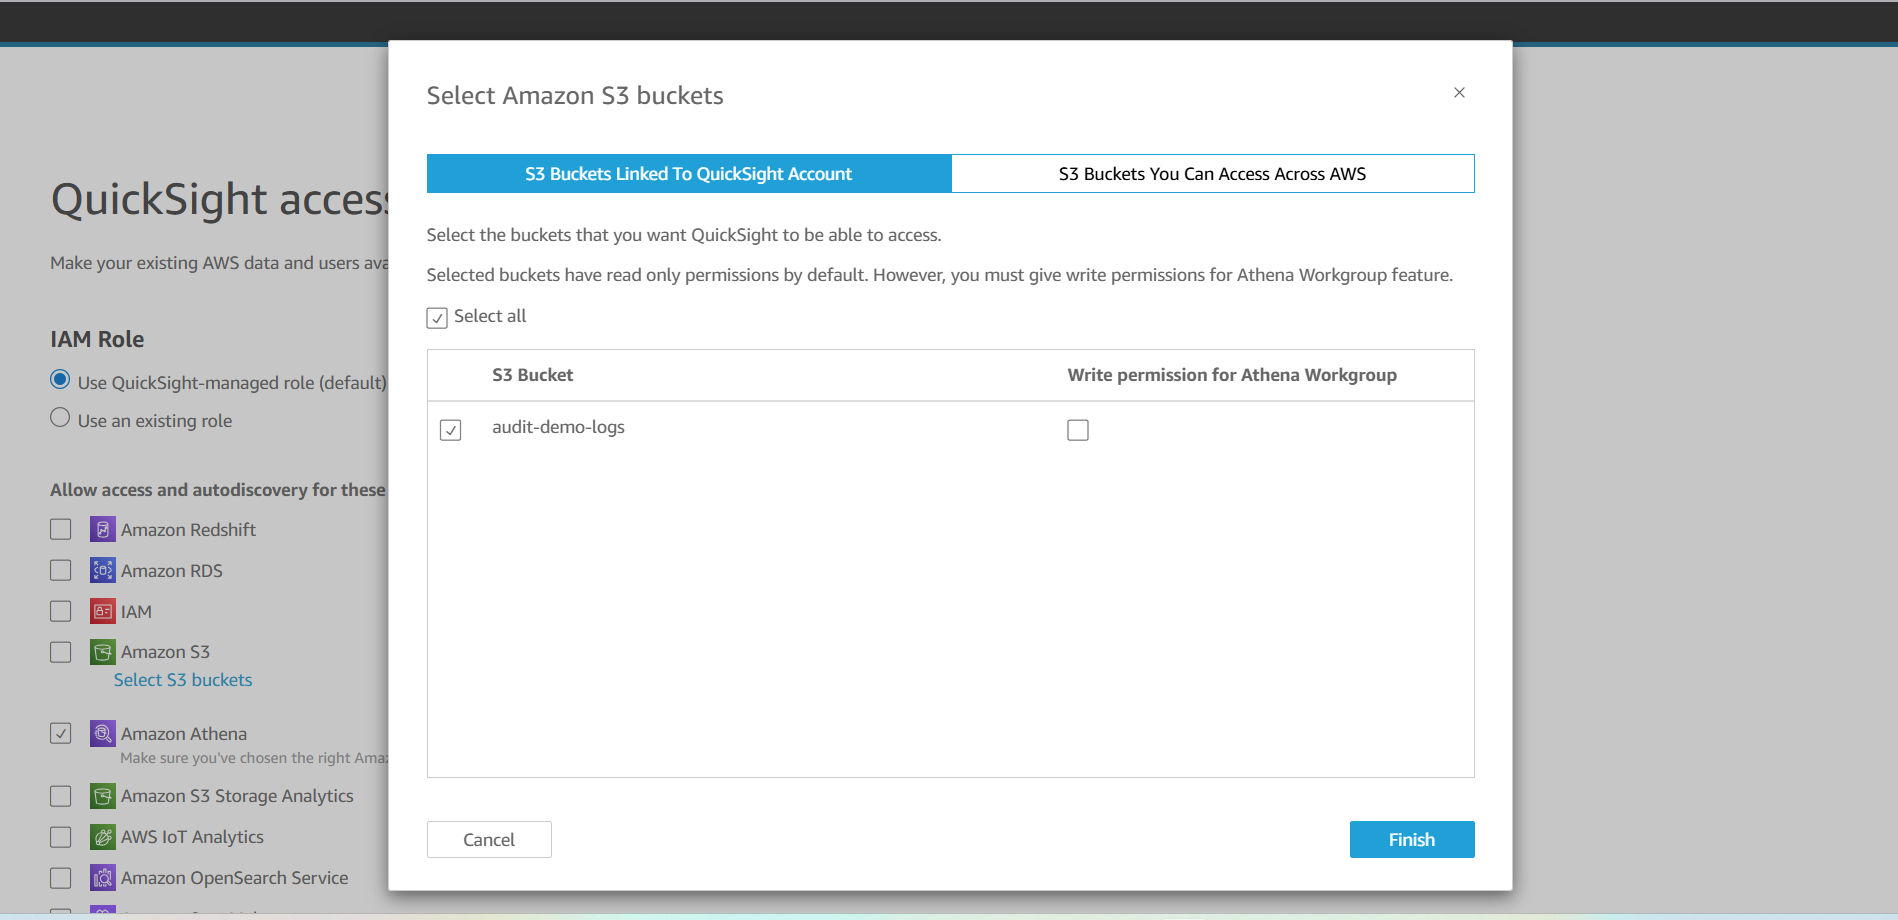
- QuickSight now has permission to run queries on Athena and read results in S3.
- Build Analysis & Visuals
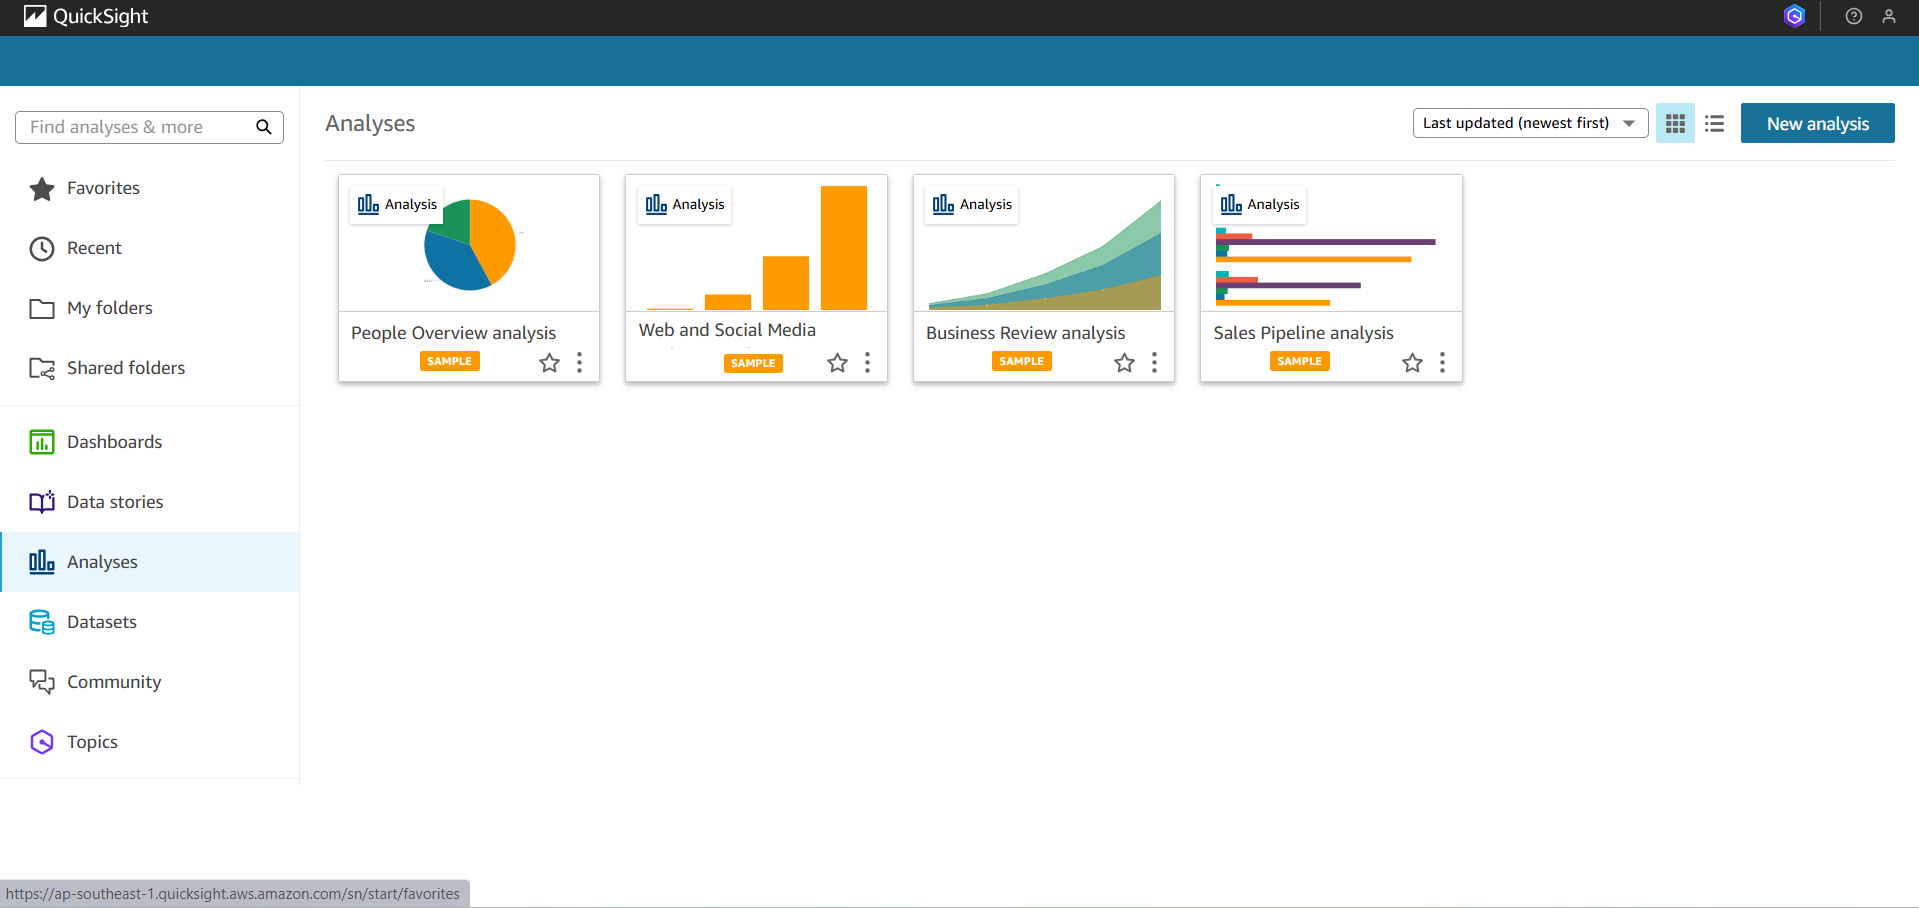
- From QuickSight Home → click Datasets (left menu) → New dataset.
-
Select Athena → Connect.
-
Enter Data source name:
AuditLogsAthena→ Create data source. -
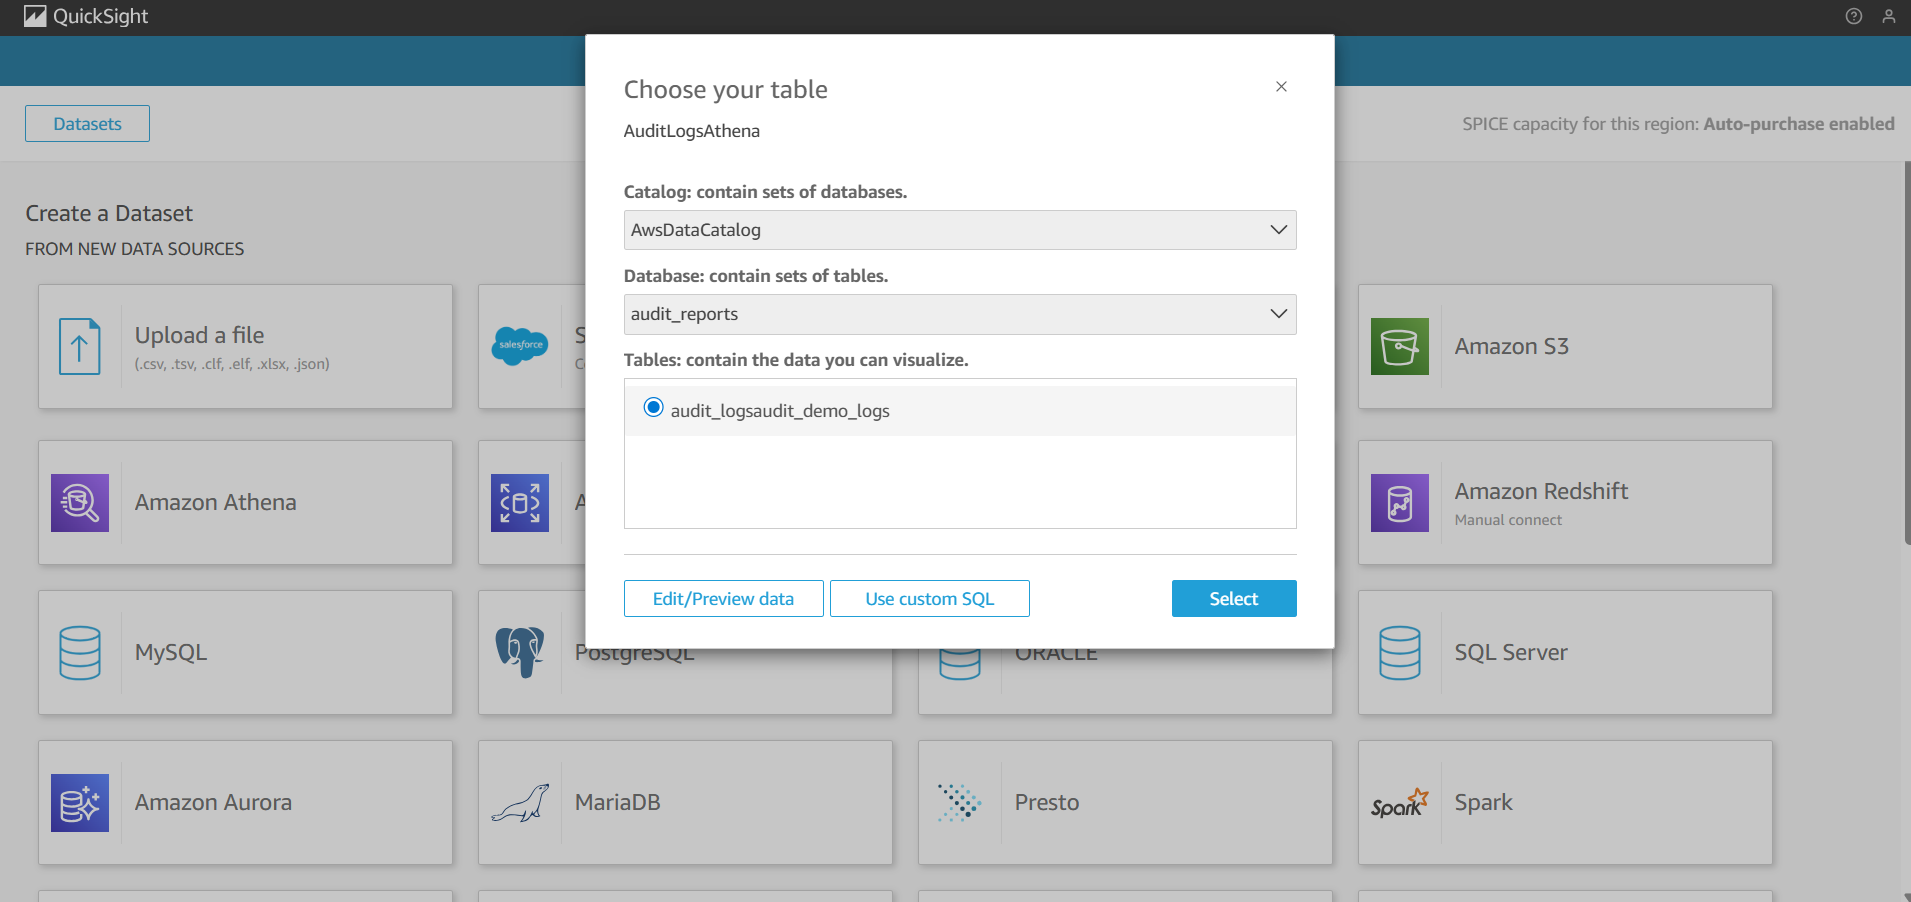
On the data selection screen:
-
Database:
audit_reports -
Table:
audit_logsaudit_demo_logs
-
-
Click Select → you will see a preview of the table.
-
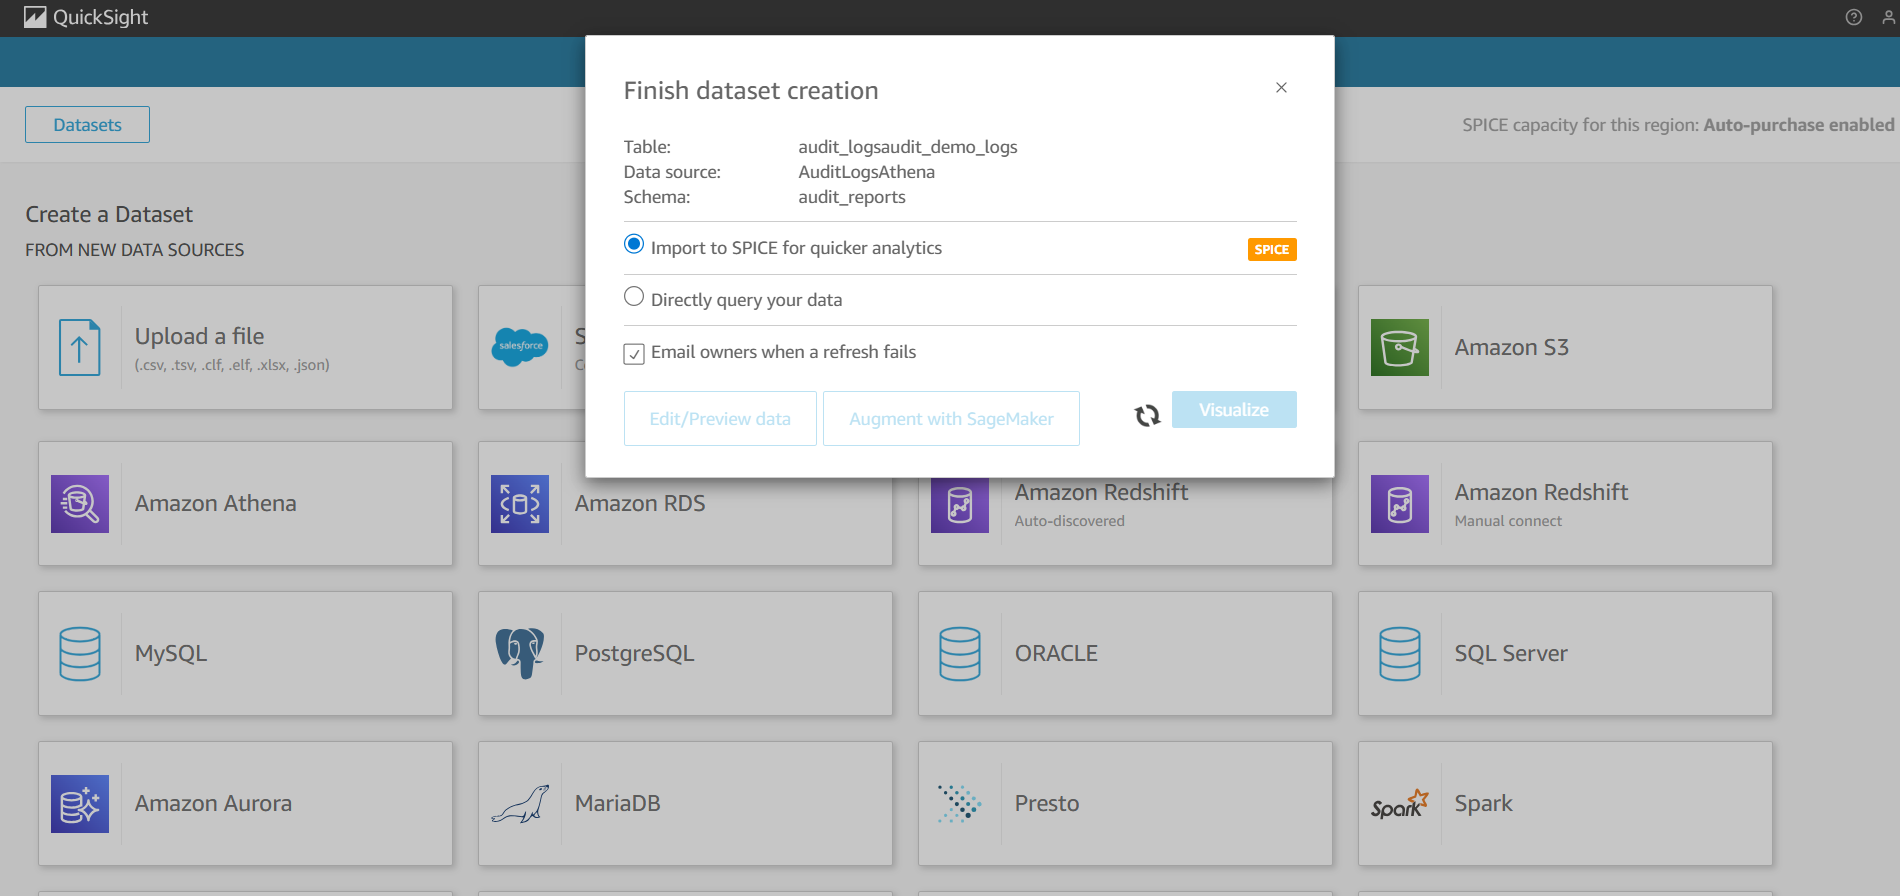
Enable Import to SPICE for quicker analytics → Visualize.
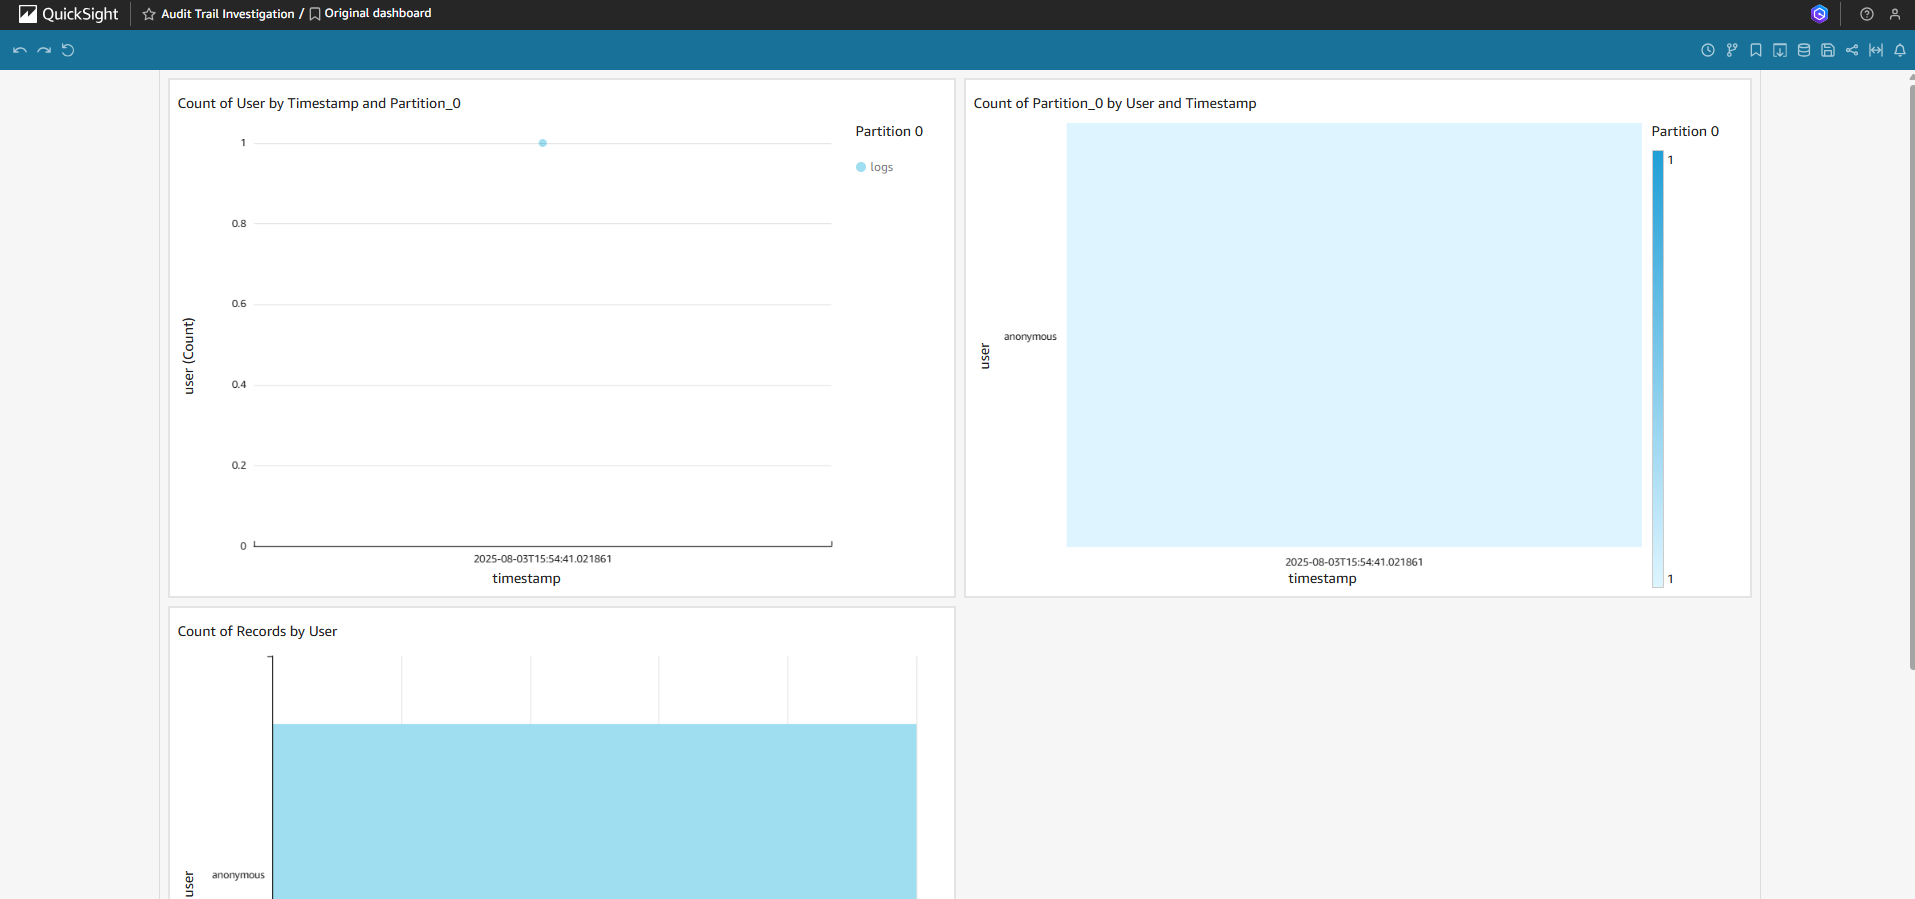
- Build Analysis & Visuals.
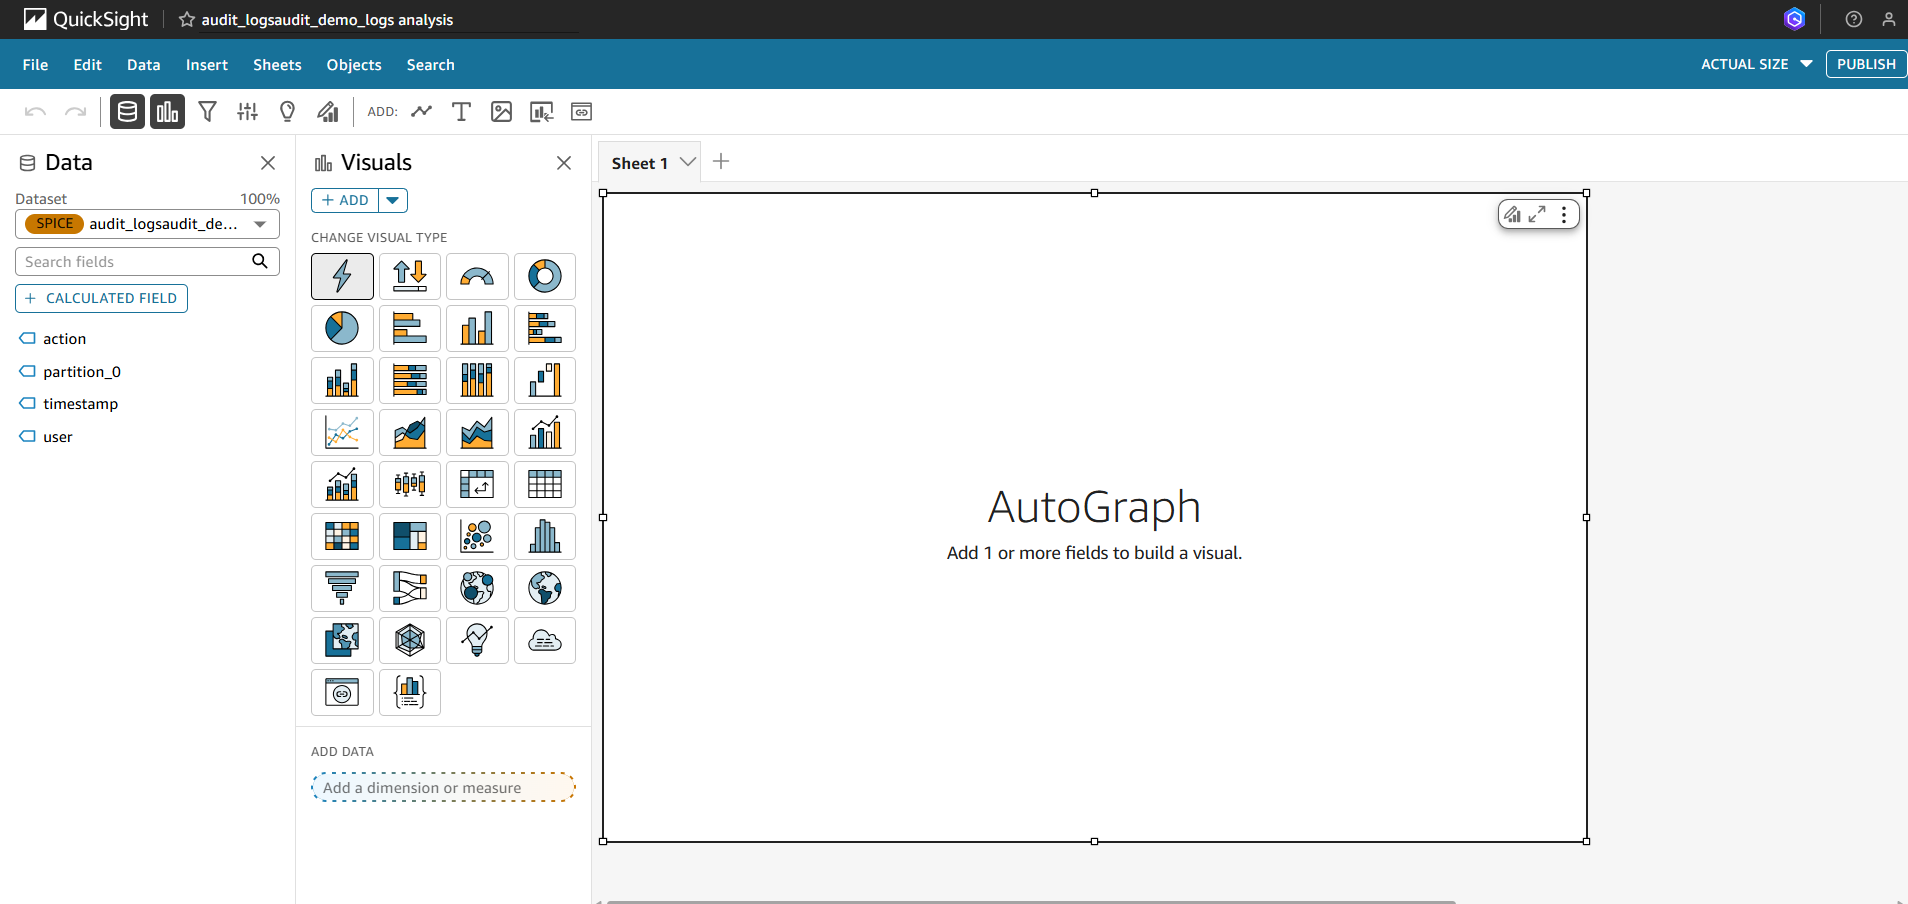
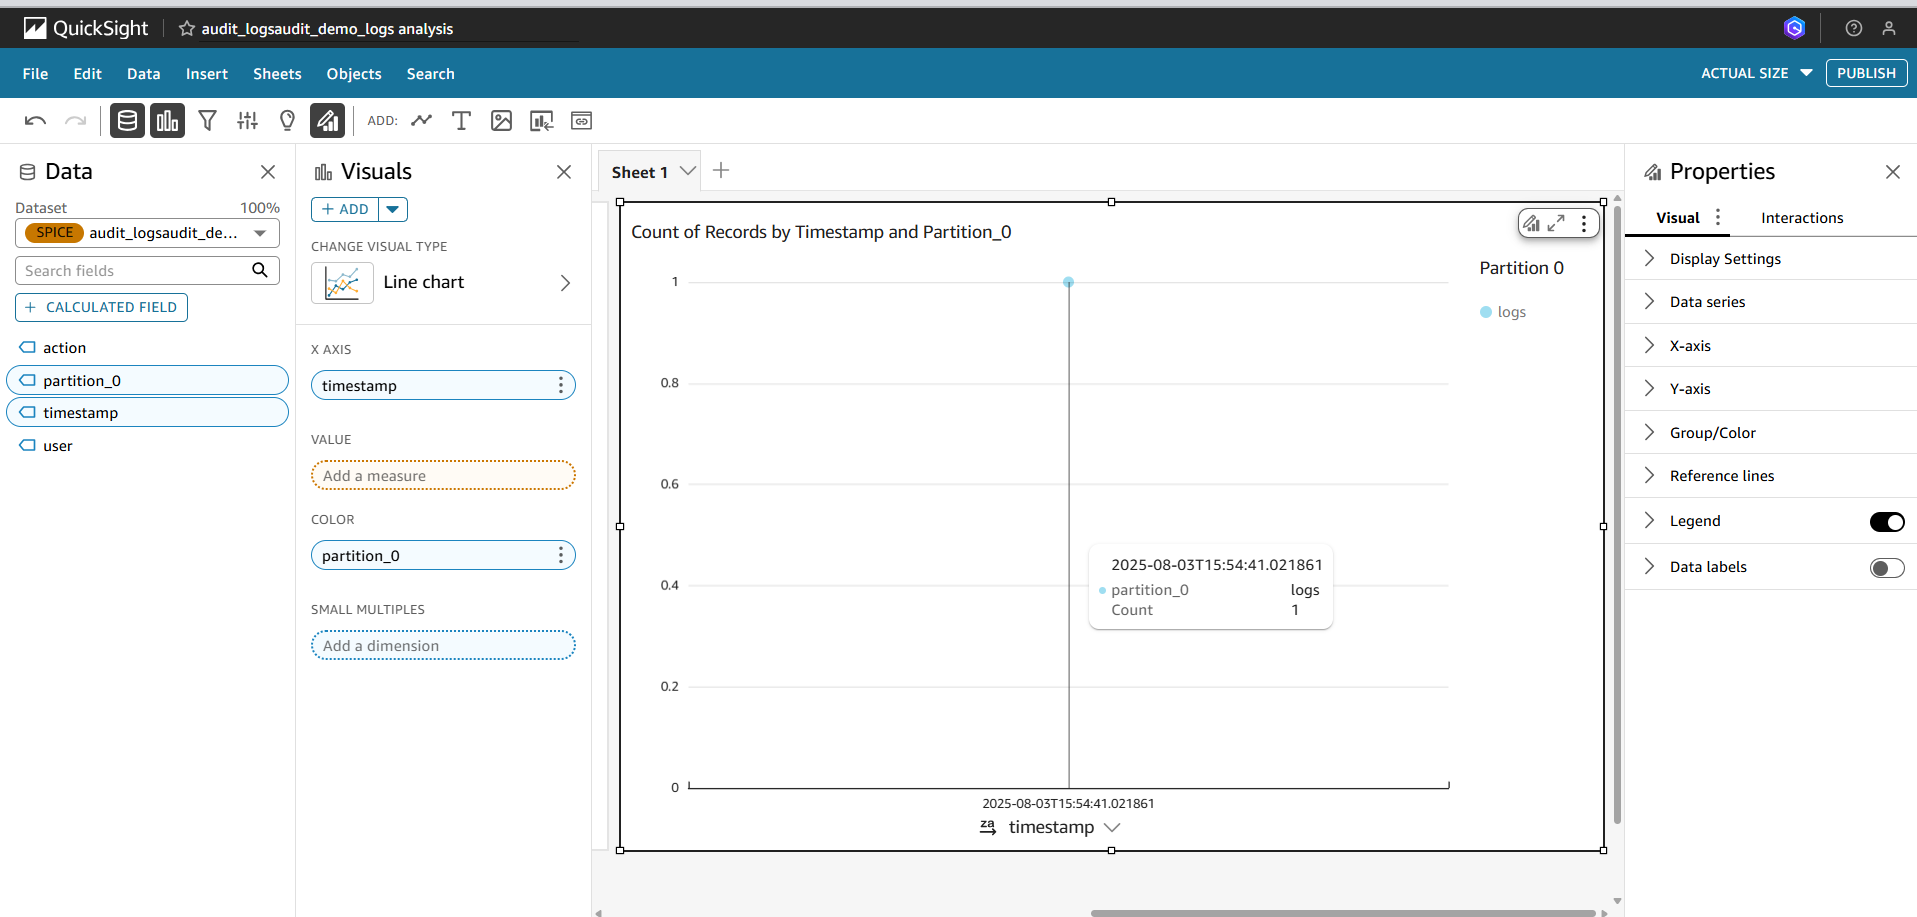
- Draw Timeline Events:
- In the Visuals pane, click the + ADD button → select Add visual.
- Drag the
timestampfield from the Data pane to the X axis area in the Field wells pane. - The chart will show the number of events over time.
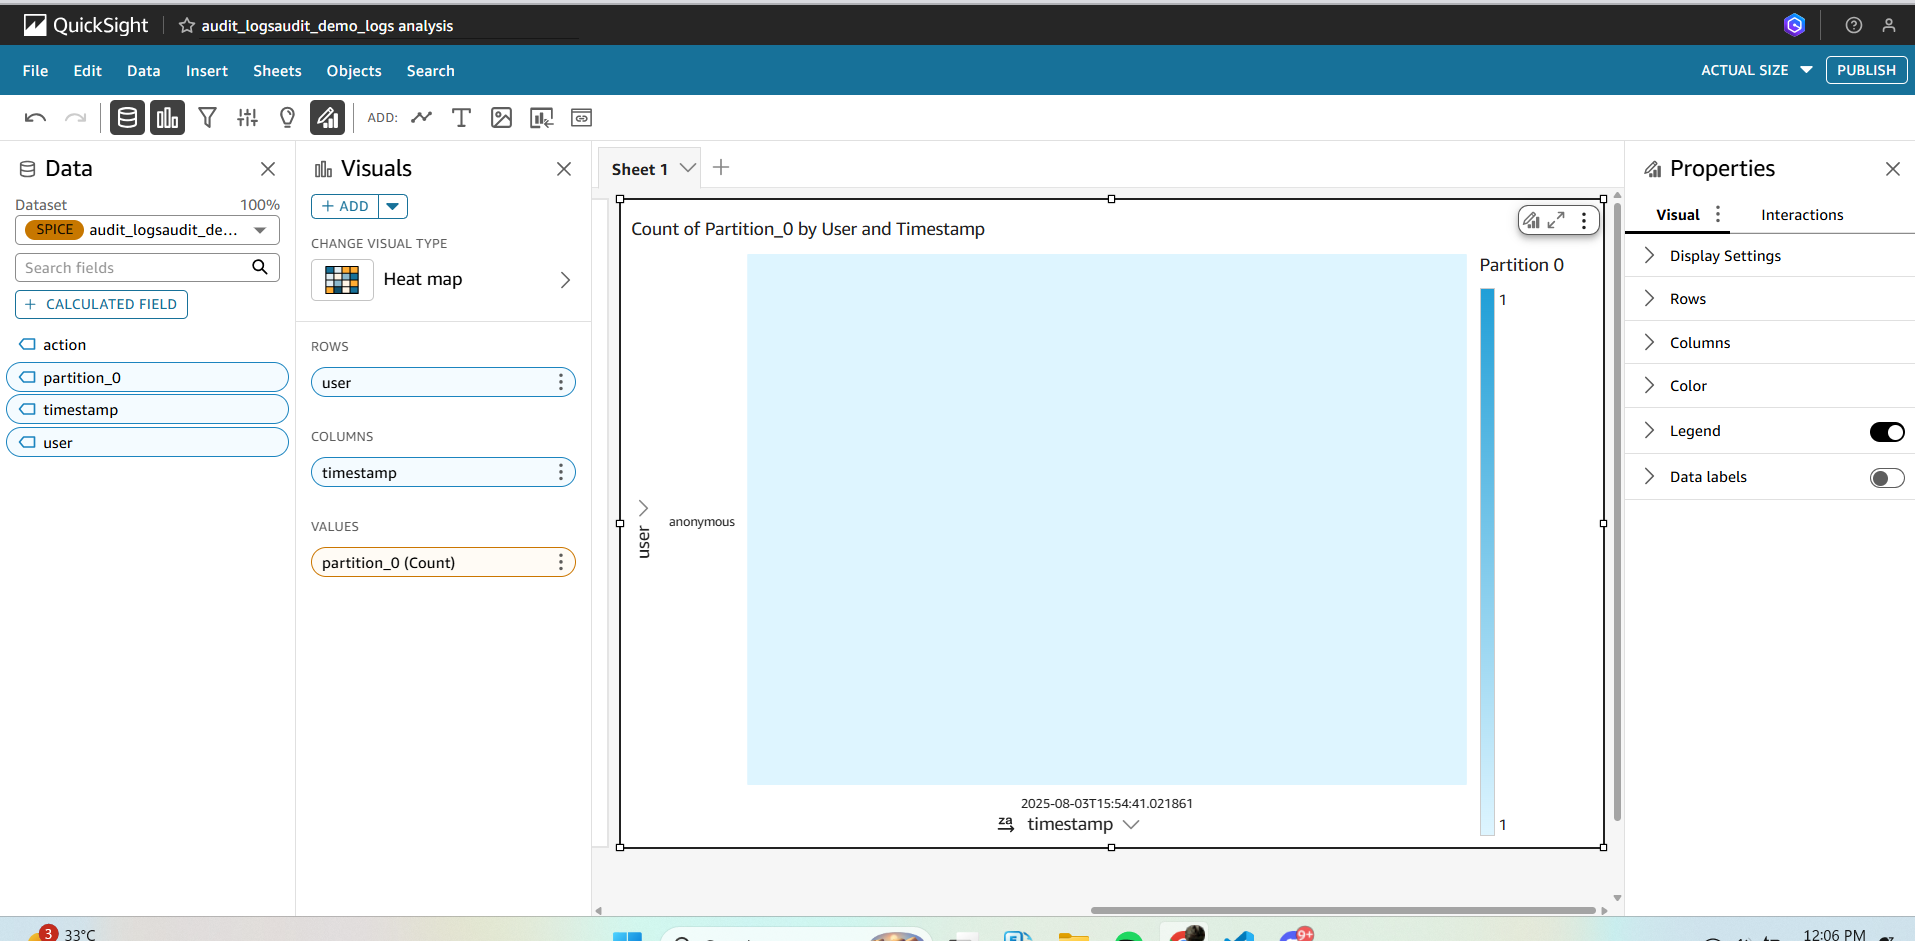
- Draw Heatmap User Activity:
- Click + ADD → Add visual.
- Select the Heat map icon. In Field wells:
- Drag
userto Rows. - Drag
timestampto Columns → click the right arrow and change Date granularity to Day. - Drag Count to Color intensity. The heatmap will show the density of events per user per day, with color intensity representing the count.
-
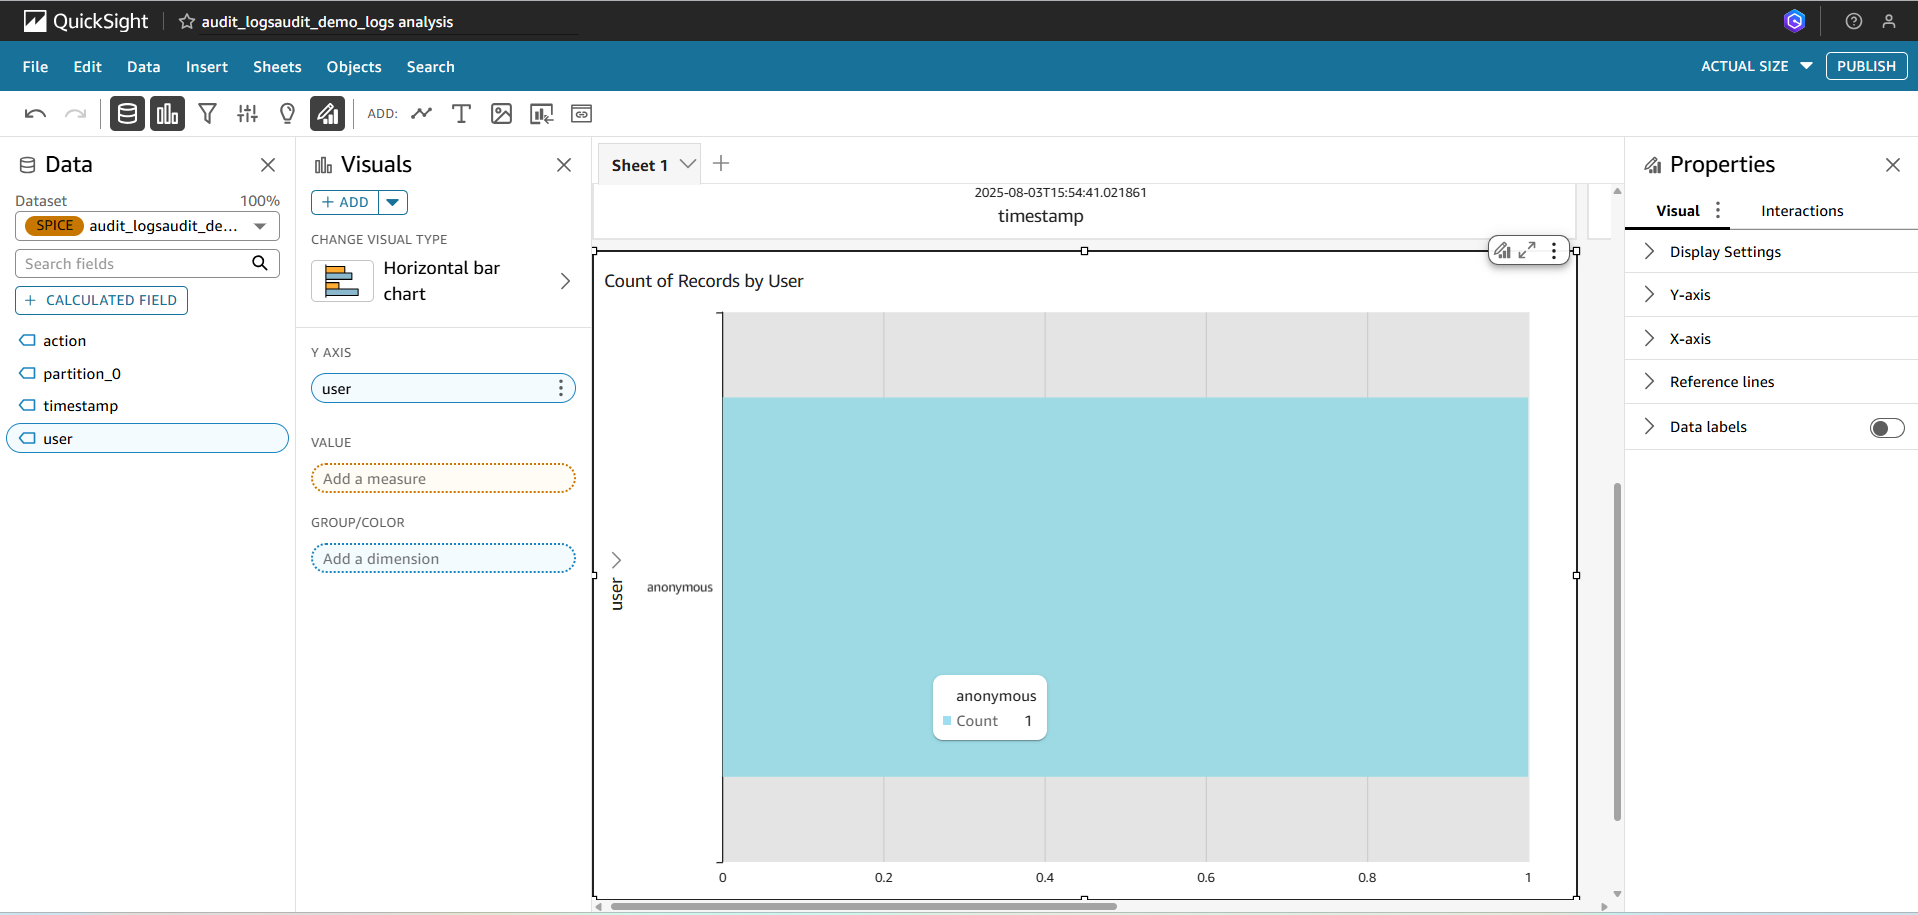
Draw Top Users:
- Click + ADD → Add visual.
Select the Horizontal bar chart icon.
In Field wells:
- Drag
userto Category. - Drag
Countto Value.
-
Add a Filter by action.
-
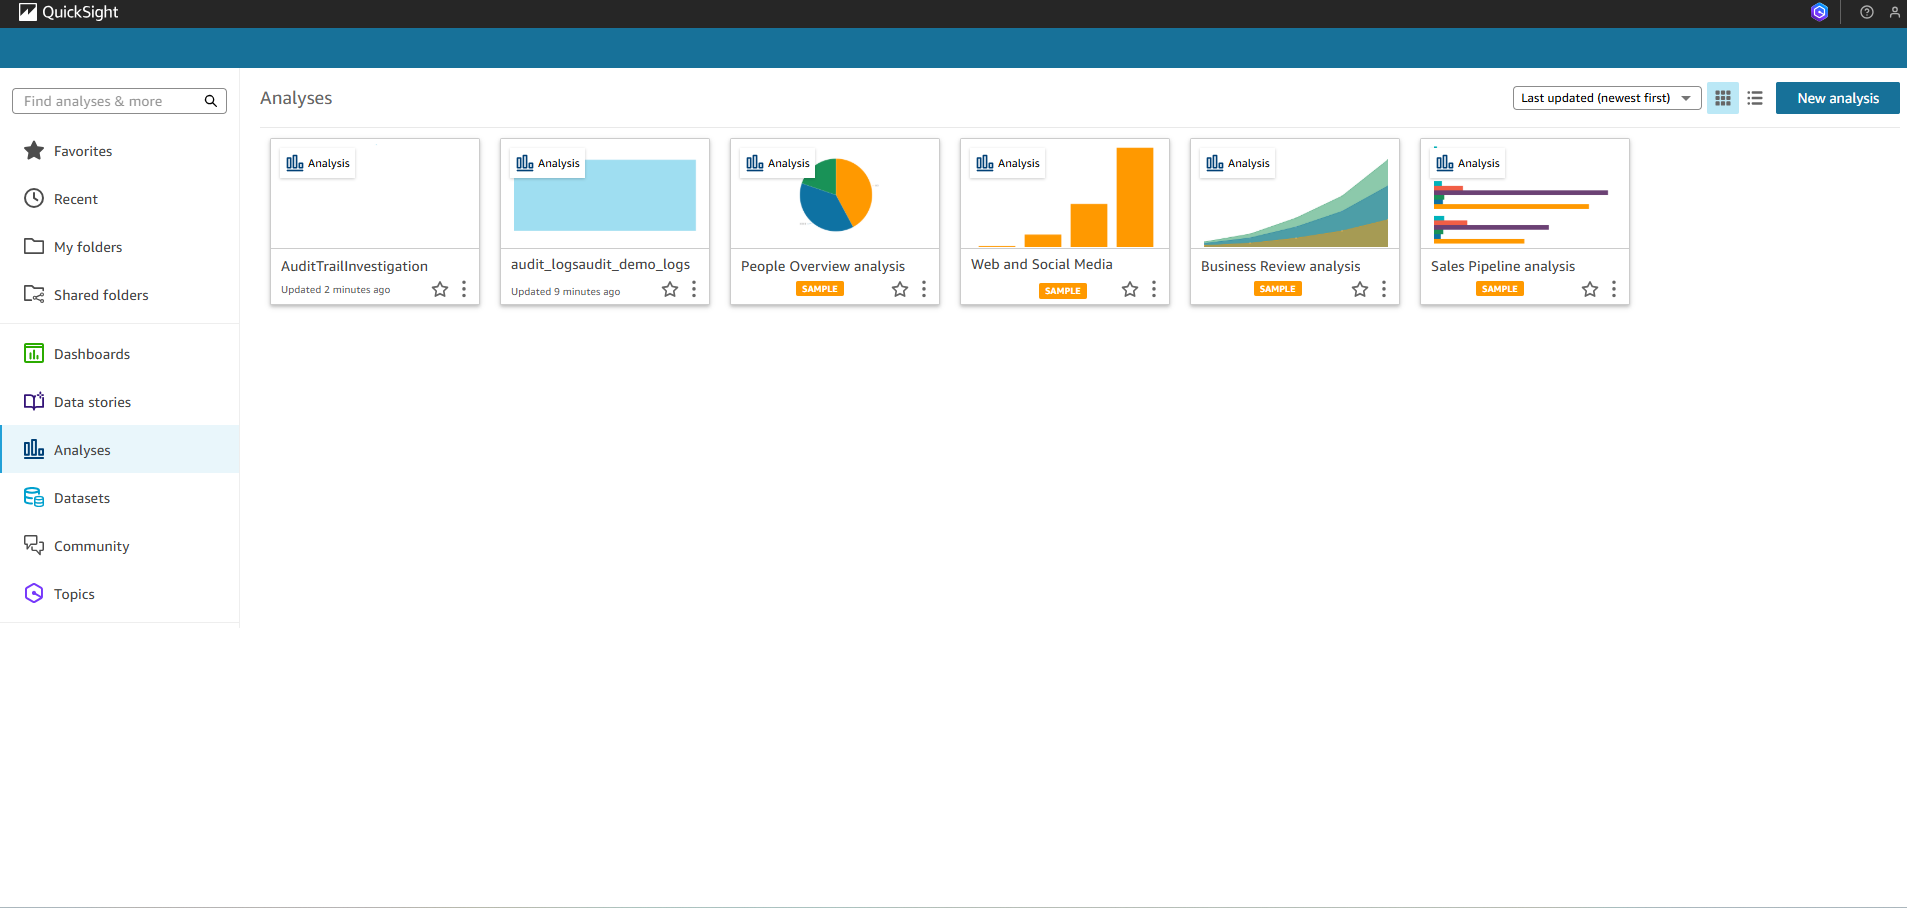
After creating all visuals, click Save and name it
AuditTrailInvestigation.
- Publish
-
In Analysis, click Publish dashboard.
-
Dashboard name:
Audit Trail Investigation.